Full Data Analysis button. The analysis presents the distribution
of your data aggregated by column.
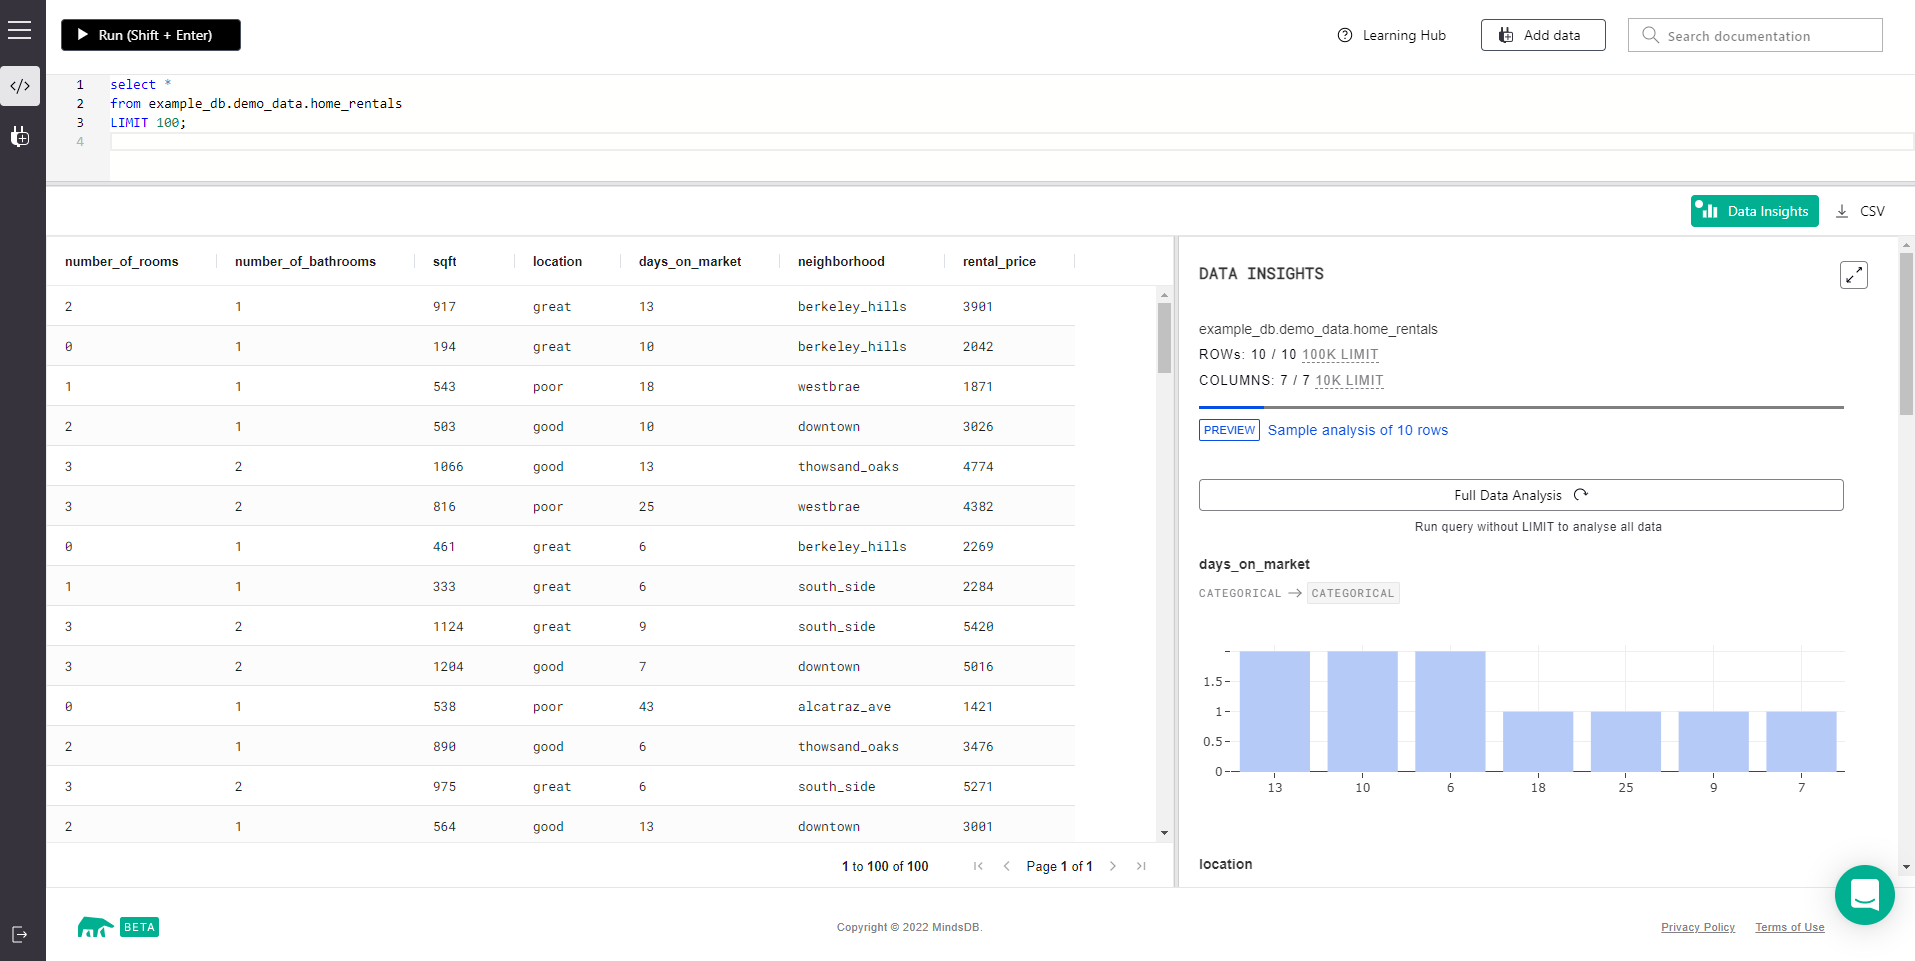
SELECT query on your
dataset. Let’s have a look at the available features.
Features
Distribution of Data per Column
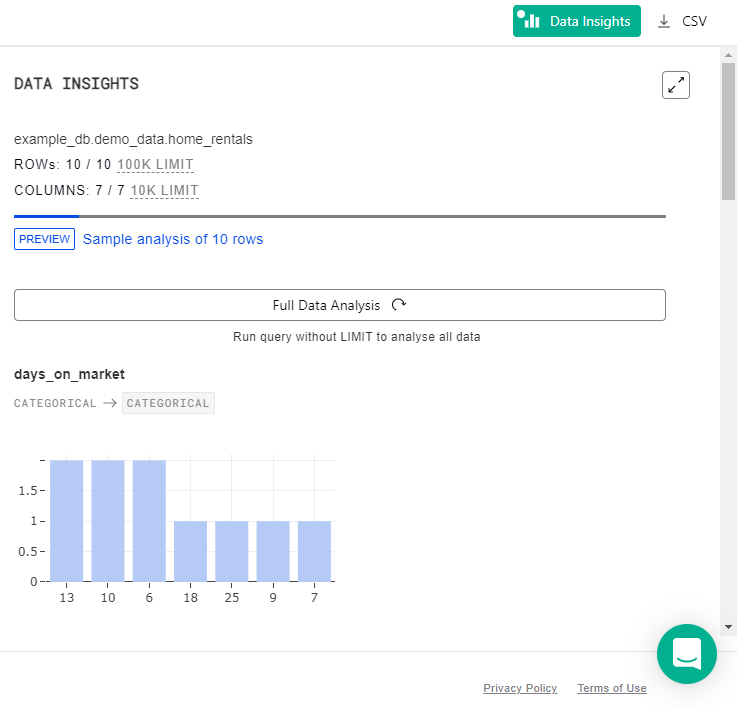
When opening the Data Insights pane, you see the distribution of data of each output dataset column. Initially, the visualization and analysis of the first ten rows is shown, as below.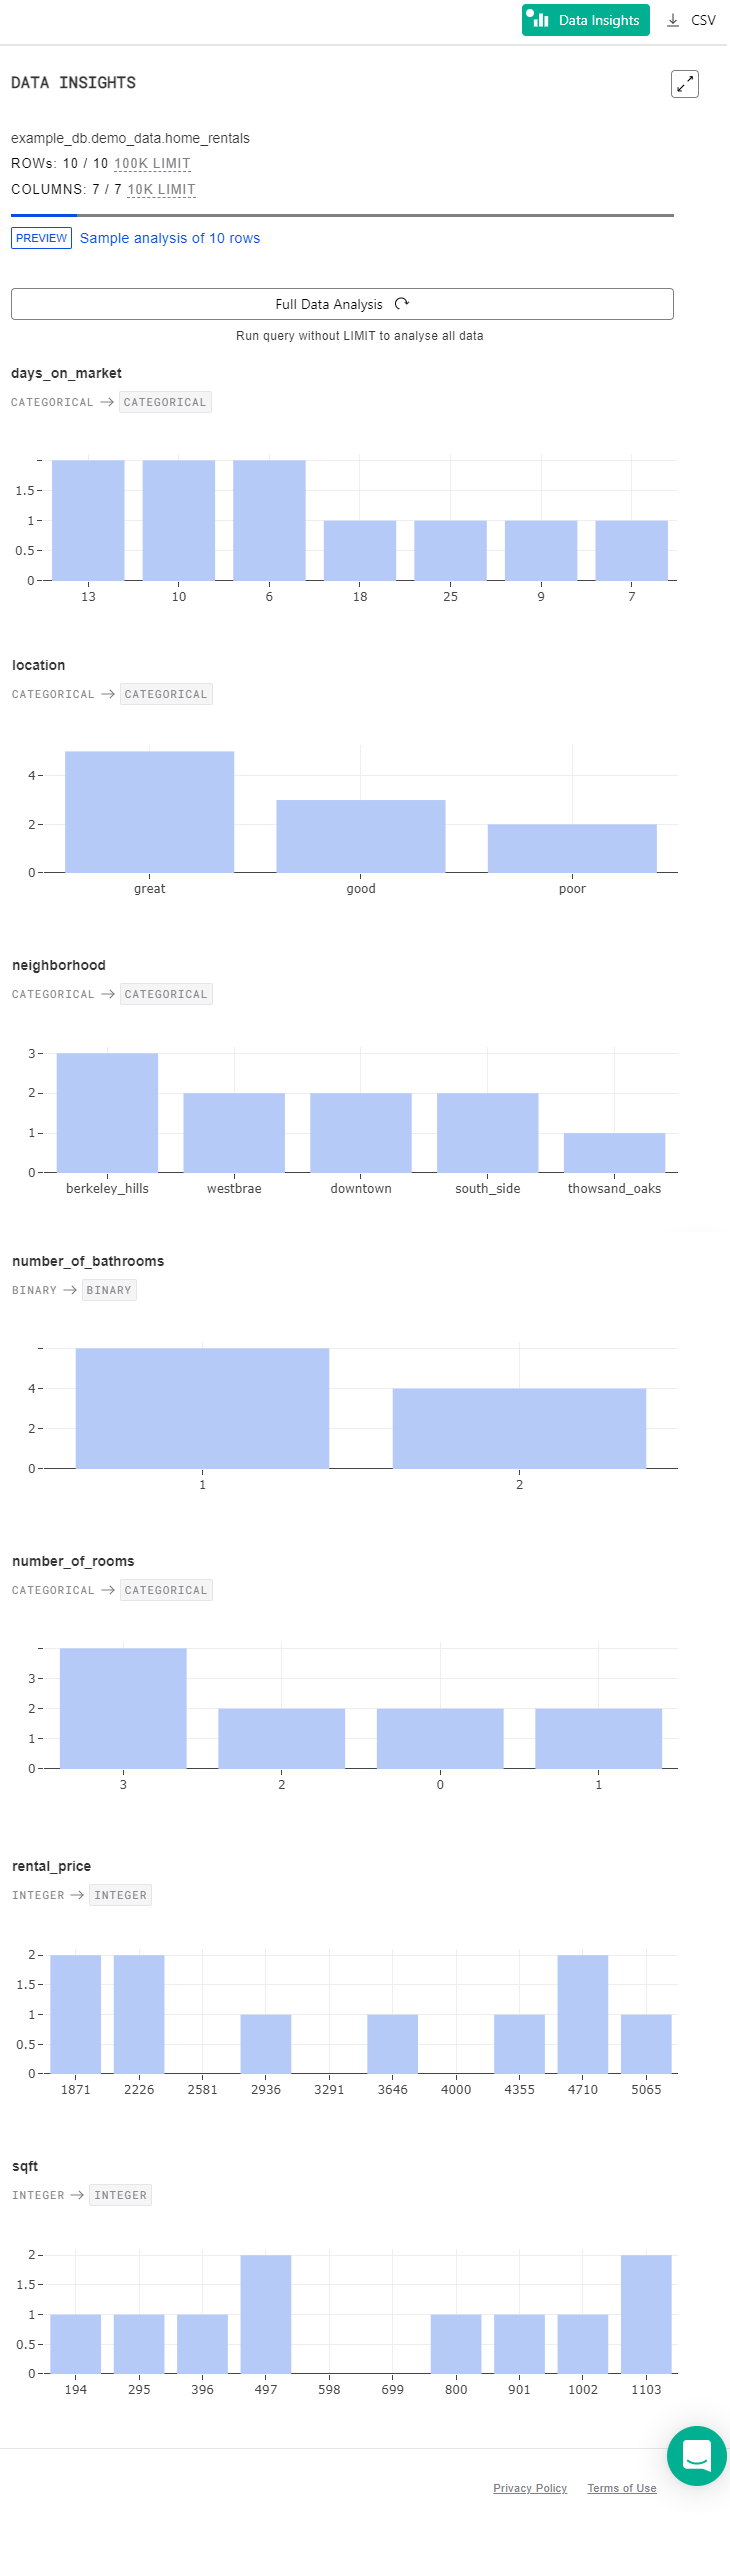
Potential Bias Flag
To see the Potential Bias flag, enter a full-screen mode of the Data Insights
pane.
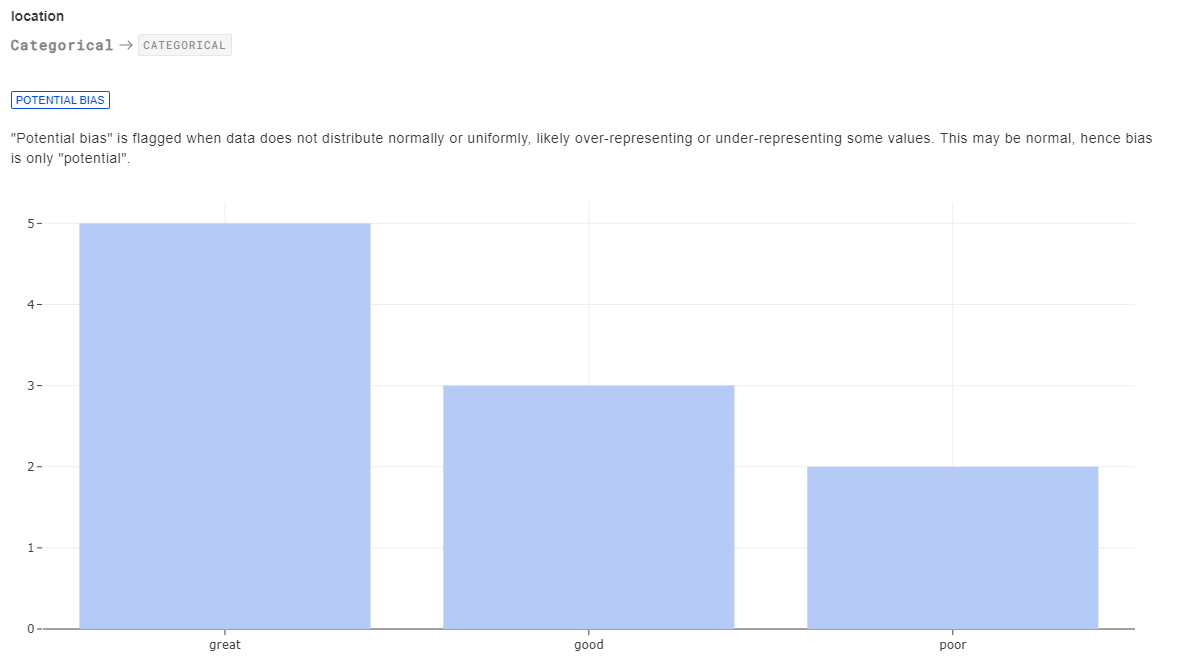
location column exhibits potential bias, as there are more great
column values than good or poor column values. Such cases are typically
flagged. However, it does not necessarily mean that there is a problem with the
dataset.
The Potential Bias flag is used when data does not distribute normally or
uniformly, likely over-representing or under-representing some values. This may
be normal, hence, bias is only potential.
Missing Values Flag
To see the Missing Values flag, enter a full-screen mode of the Data Insights
pane.
This flag indicates the proportion of missing values in a column. Columns with a
high percentage of missing values are not useful for modeling purposes. Hence,
it is recommended to pay attention to the Missing Values flag and try to
mitigate it whenever possible, as it indicates the degrading quality of your
data.
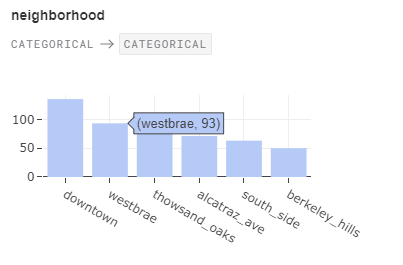
Hovering Over the Histogram
When hovering over the histogram, you get the information on a particular column value and how many of such values are present in a column. The format is(column_value, count).
Full Data Analysis
Let’s do a full data analysis step by step. First, we need to query data for analysis in the MindsDB Cloud editor. Please note that you need to query your dataset without using aLIMIT keyword to be
able to perform a complete data analysis.
Data Insights button to the
right of the output table. Initially, it shows the analysis of the first ten
rows of the output table.
Full Data Analysis button. Below
is the complete data analysis.
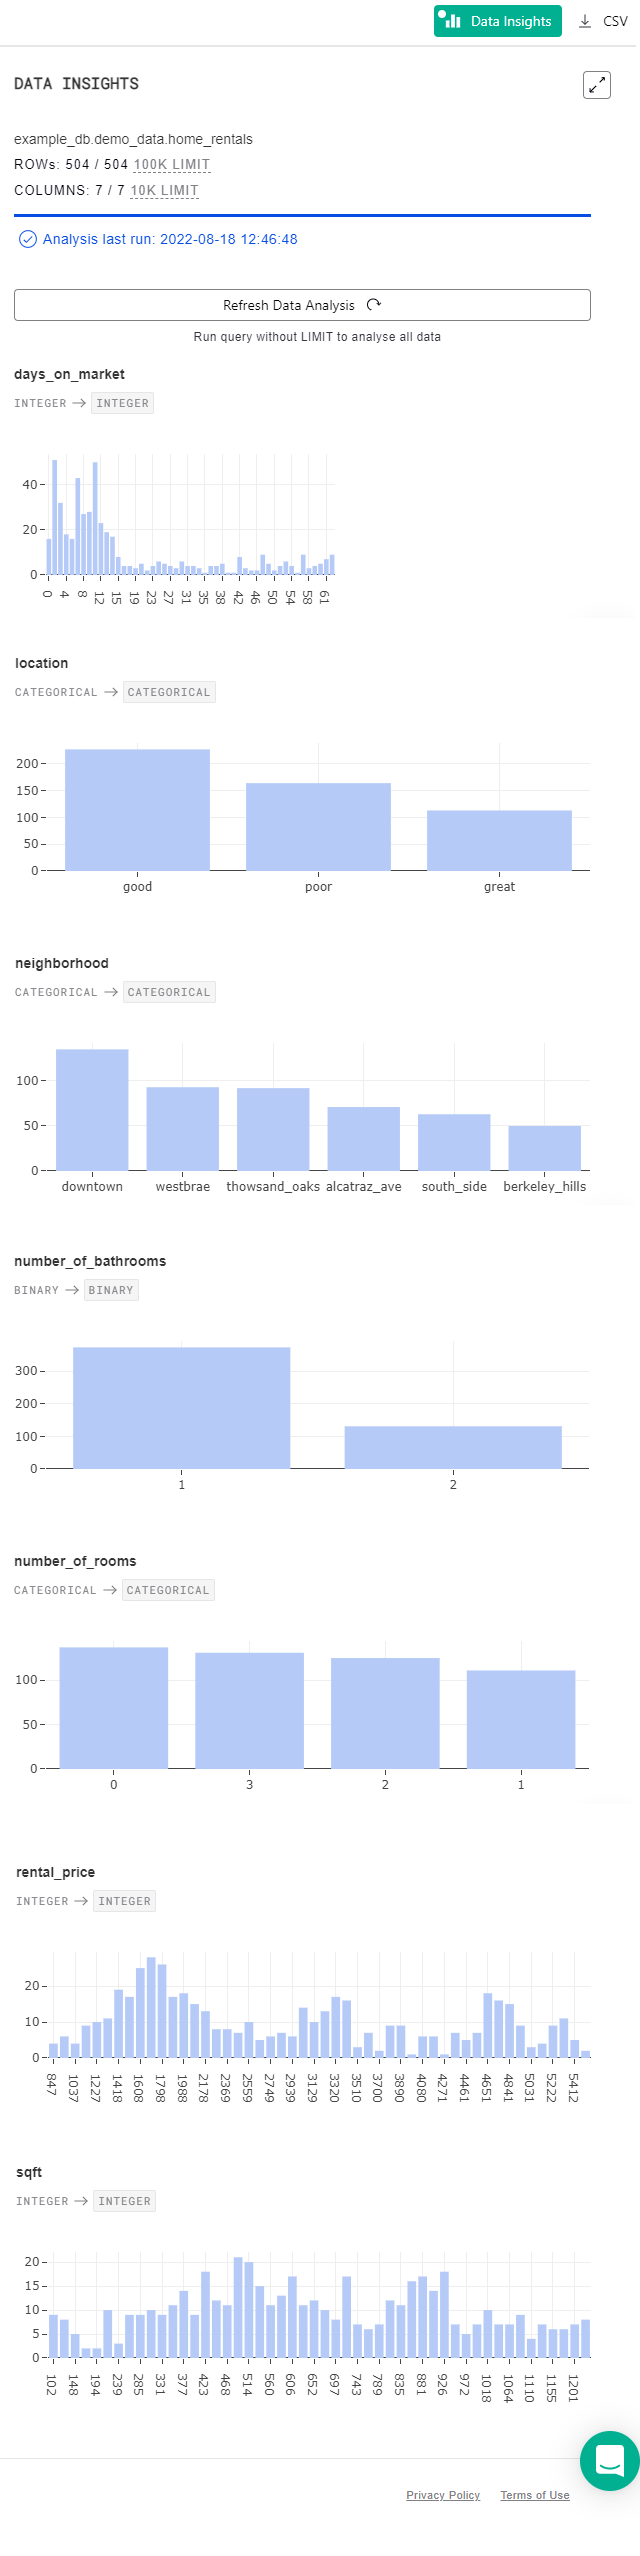
Refresh Data Analysis button to update the data visualization and analysis.